All-cash home purchases are on the rise again. The question remains who paid in cash? Where sales buoyed by retirees or pure speculators? During Q1:14, 42.7% of the existing homes sold in the U.S. were purchased entirely in cash, up from 37.8% last quarter and 19.1% in Q1:13. Institutional investors (entities that have purchased at least 10 properties in a calendar year) accounted for only 5.6% of all U.S. residential sales in Q1:14, the lowest level since the first quarter of 2012 and down from 6.8% in Q4:13 and 7.0% in Q1:13.

Nevertheless, 52% of all-cash purchases in March were sold to buyers with a different mailing address than the property address. So did the data under report Institutions, retirees or Flippers? 15% of all-cash purchases in the first quarter were properties in the foreclosure process, and 10% were bank-owned properties.
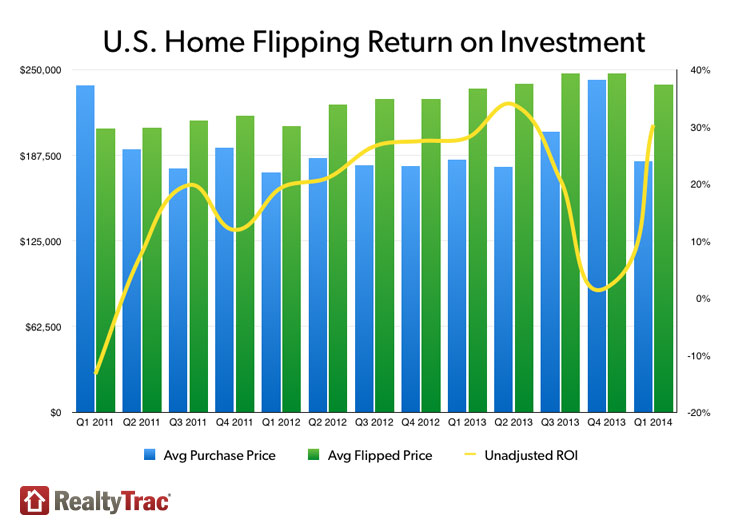
3.7% of all U.S. single family home sales were flips (home is purchased and subsequently sold again within six months) in the first quarter of 2014, down from 4.1% in Q4:13 and down from 6.5% in Q1:13.
 Interestingly, 43% of all properties flipped in the first quarter were all-cash sales to the new buyer. Sales of distressed homes—those saddled with a past-due mortgage or foreclosure—declined to 15% of existing-home sales in the first quarter from 17% last year and from 26% in 2012.
Banks have tightened lending standards. The important trend here is the tightening in the “nontraditional” mortgages. Household formations have stalled. It will be difficult to get the demand going until growth in households picks up again.
 This weakness in housing is now reflected in the equity markets as shares of homebuilders underperform.
The question is whether the increase in cash purchases is a sign of strength in the housing market and a reason to go long….

 Sales have been soft, in part, because builders have been slow to ramp up production. While inventories are still very low, they are up 16% from last year.
 Caught last year with a surge of demand and a shortage of supplies, builders boosted prices. As sales have slowed and builders have increased production, they’ve cut back on those price increases. Several executives have conceded that prices probably went up too fast last year, especially after the unexpected jump in mortgage rates that pinched affordability last summer.